Oct 27, 2022
Turbulent Times Build Great Fortunes
With the ongoing rainy season, it certainly feels like “winter is coming” – in fact, it is also raining plenty in the equities market. However, the sun always comes out after the rain, as we can see from how a $10,000 invested grew for the past 40 years in the chart below despite the turbulence.
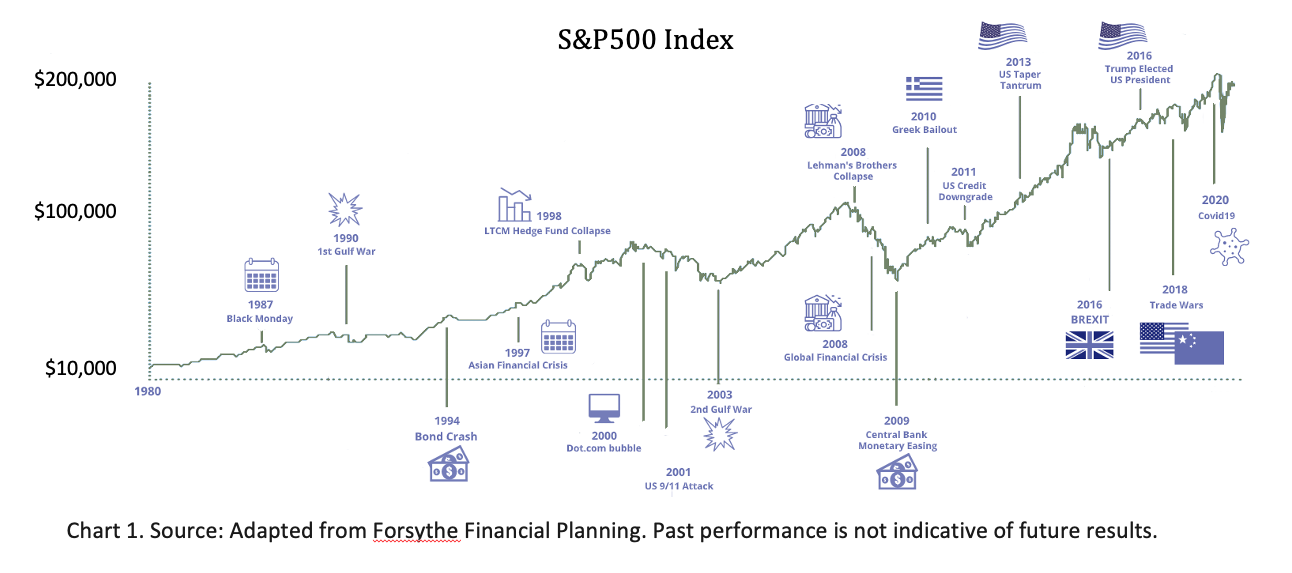
And have you ever encountered someone jumping out of a plane during a turbulence? Probably not. However, when it comes to investing, people do “jump out” during turbulent times and suffer losses. Reading the equities market more recently, the market has declined 27% as shown by the MSCI All Country World Index (ACWI) below since the start of the year till 30th September, how do we take advantage of this current market downturn, knowing that the tide WILL turn, given time?

There is a very simple and powerful method, which is available to all of us, and would work especially well to build our wealth during this market decline.
This proven method is called dollar cost averaging (DCA).
What is DCA and how does it work?
Dollar cost averaging involves investing the same amount of money in a target security at regular intervals over a certain period of time, regardless of price. In this way, the investor buys more shares/units when the market is low than when it is high, and the investor is likely to end up with a satisfactory overall price for all the holdings.
See the illustration below on how dollar cost averaging works:

Chart 3. Source: Adapted from Wealth Academy
What makes DCA so special?
1. DCA averages down the cost of each unit bought
When the market becomes more turbulent, DCA allows investors to buy in at even lower prices. When we invest the same dollar amount every month, we essentially buy more units when the price is lower. In the chart above, the average price of the 8 points of investment is $10.06. However, the actual average unit cost is $9.61. The difference is because more units are being purchased at those points with lower prices compared to those at higher prices, hence lowering the average unit cost. When the market recovers, the units appreciate. Investors who have amassed more units during a turbulent market will thus experience greater growth in their investment. As such, even though the price of the investment is the same at the start and at the end of the period, the investor made a profit of 4.07% simply by dollar cost averaging. What could make the returns even more pronounced is to increase one’s monthly investment as the markets decline further.
2. DCA is automatic
DCA is a reliable strategy for investors who do not have the time nor the inclination to time the market – it helps to set up a sound framework of automatically investing the same dollar amount every single month over the entire bear market. As following through and making it a habit are what will help investors invest successfully over the long term, automating the process with DCA makes it foolproof as it reinforces the practice of investing regularly to build wealth over time.
3. DCA takes emotions out of the equation
As the emotional brain is bigger and more powerful than the rational brain, people tend to feel a sense of panic during heightened volatility, said Dr Brad Klontz, a financial psychologist1. Rationally, stocks on a discount should be making investors jump for joy instead of tearing their hair out. DCA helps to ease the emotions as market noise is even louder when the market is in a decline, riling up the emotions even more. Just like how a math wizard may struggle to do basic math while he is on a roller coaster ride, the best investors may struggle with making sound investment decisions when the market is tumbling. With DCA, there is no need to decide whether to invest or withdraw your money.
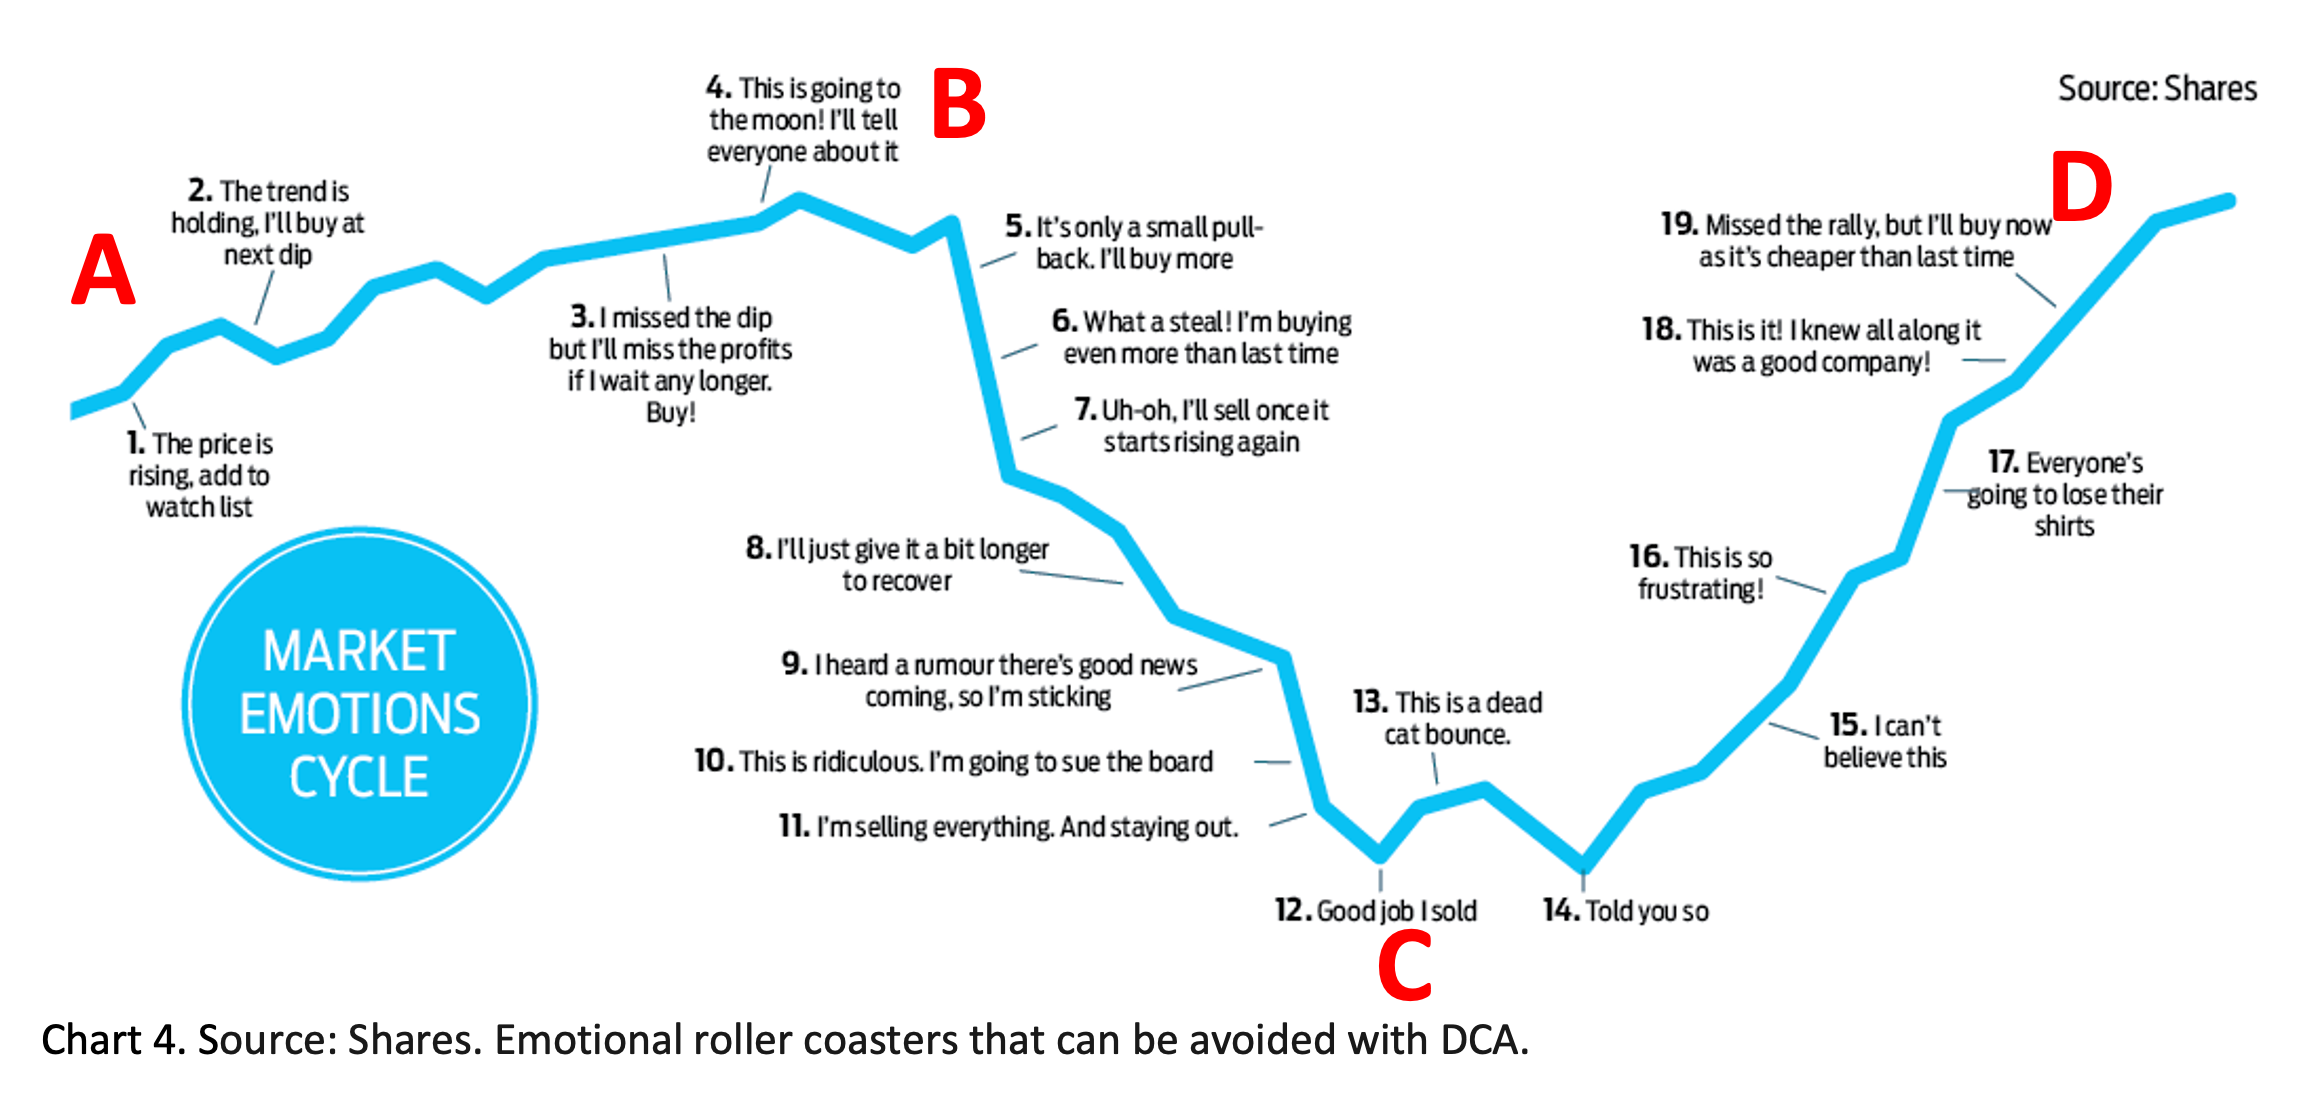
Rational investors would respond with “C” in the above chart as the best time to invest, yet research has shown that most people had been selling their investments at “C” instead of buying in more, after going through a roller coaster ride via A, B and then C. Thus, DCA takes away the need to respond to one’s emotional whims, and stay on course.
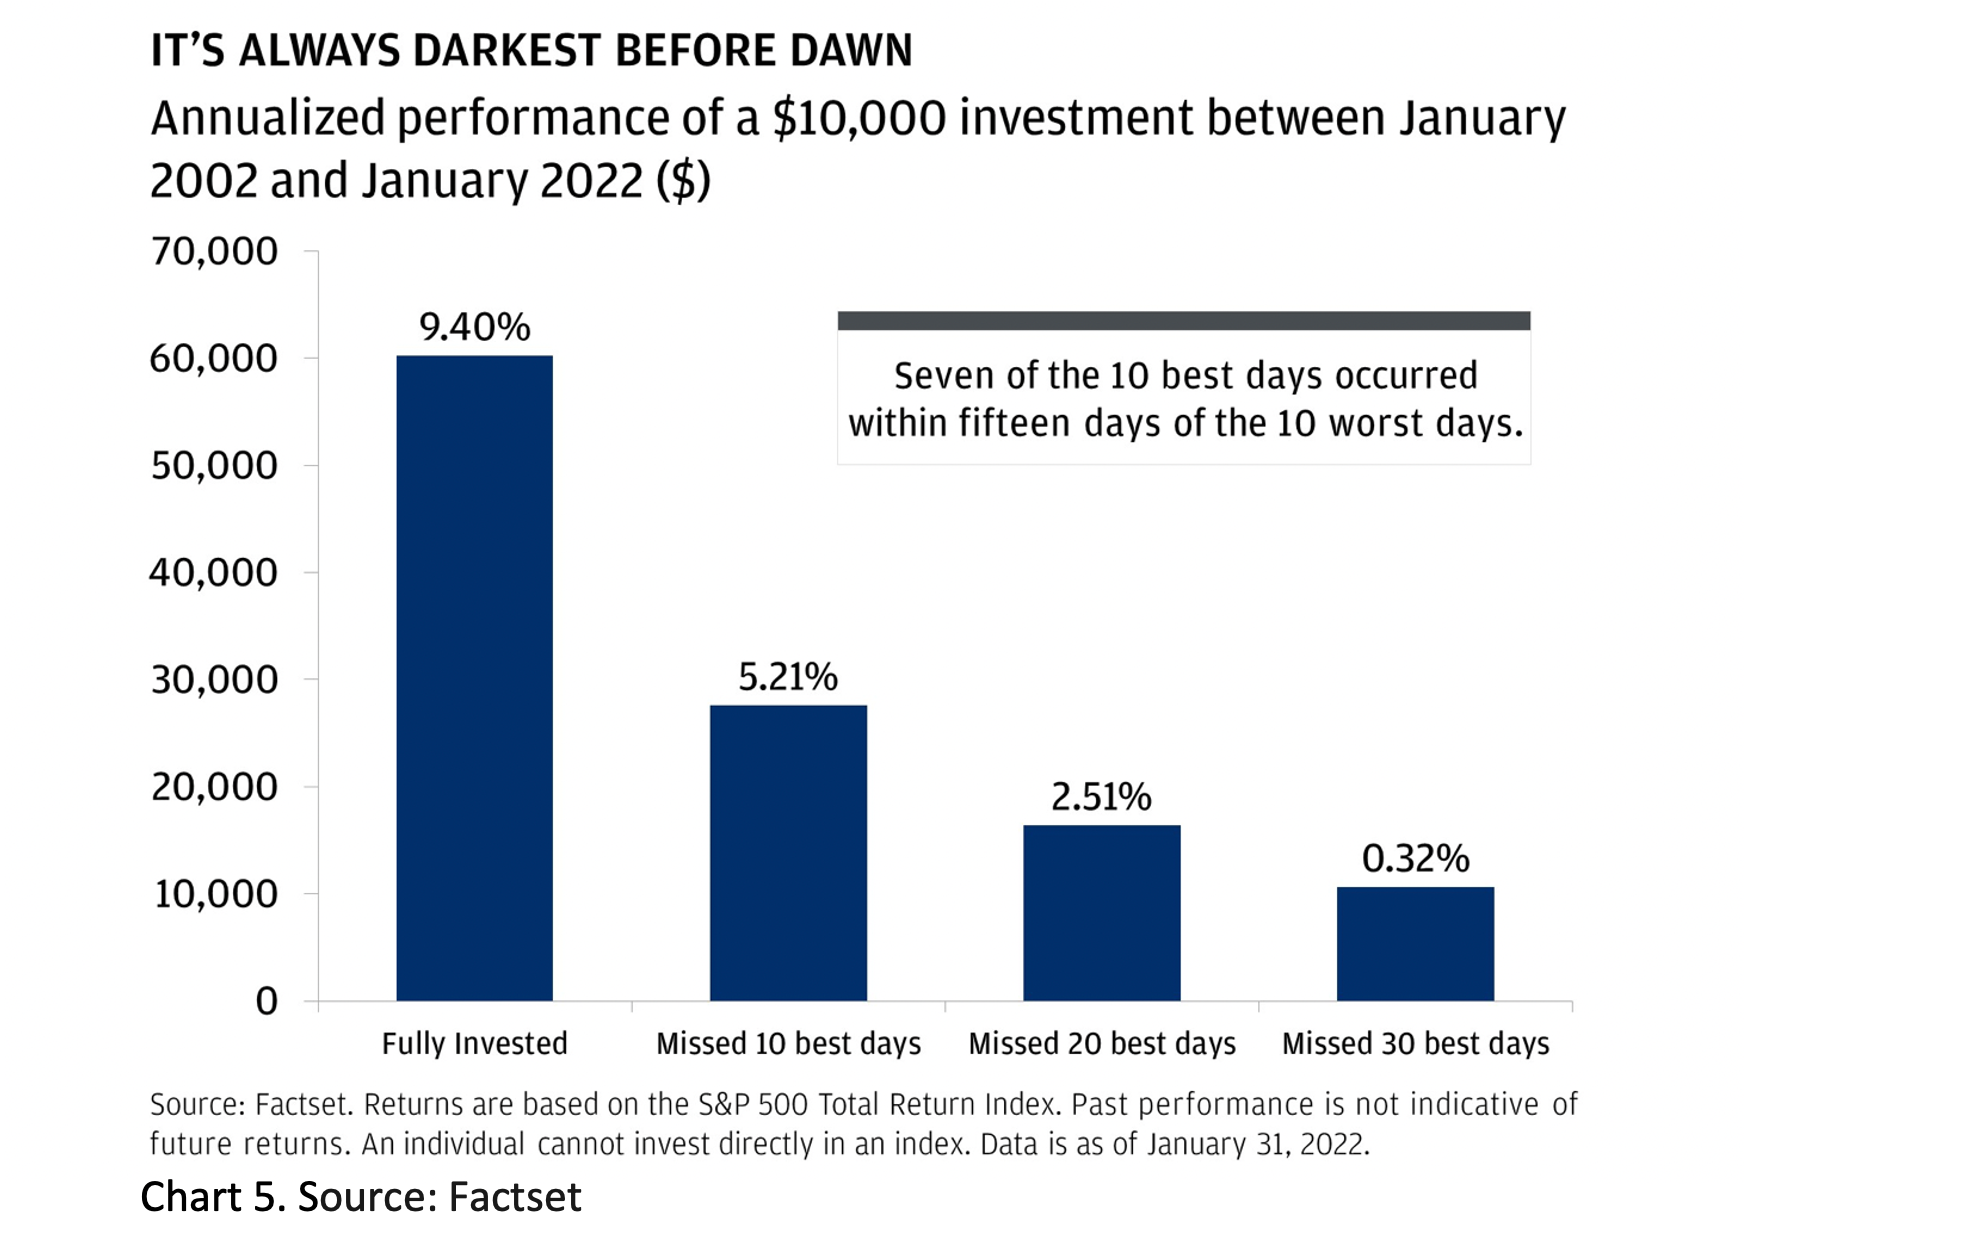
Also, seven of the 10 best days of the market occurred within fifteen days of the 10 worst days. Without the benefit of hindsight, it would be easy for someone to miss the best days just because he was trying to avoid the worst days.
Conclusion
We had a experienced a prolonged bear market 15 years ago, where the stock market went on a huge discount. Today, a similar opportunity has arisen. We think that the dollar cost averaging strategy presents another excellent way to benefit from this opportunity.
Instead of doom and gloom, imagine the news about the equities market announced cheerily like this: “Stocks became more attractive yet again today, as the Dow dropped another 2.5% on heavy volume – the fourth day in a row that stocks have gotten cheaper. Tech investors fared even better, as leading companies like Microsoft lost nearly 5% on the day, making them even more affordable. That comes on top of the good news of the past year, in which stocks have already lost 50%, putting them at bargain levels not seen in years. And some prominent analysts are optimistic that prices may drop still further in the weeks and months to come2.”
As we get excited about the bargains to come, we also need to be sure we are able and ready to embrace the volatility that comes with the reward of this strategy.
Sources:
1.CNBC
2.The Intelligent Investor
3.Images: Forsythe Financial Planning, Bloomberg, Wealth Academy, Shares, Factset
Important Notice
The information herein is published by Unicorn Financial Solutions Pte. Limited. (“Unicorn”) and is for information only. This publication is intended for Unicorn and its clients or prospective clients to whom it has been delivered and may not be reproduced or transmitted to any other person without the prior permission of Unicorn. The information and opinions contained in this publication has been obtained from sources believed to be reliable but Unicorn does not make any representation or warranty as to its adequacy, completeness, accuracy or timeliness for any particular purpose. Opinions and estimates are subject to change without notice. Any past performance, projection, forecast or simulation of results is not necessarily indicative of the future or likely performance of any investment. Unicorn accepts no liability whatsoever for any direct indirect or consequential losses or damages arising from or in connection with the use or reliance of this publication or its contents. The information herein is not intended for distribution to, or use by, any person or entity in any jurisdiction or country where such distribution or use would be contrary to law or regulation. If this publication has been distributed by electronic transmission, such as e-mail, then such transmission cannot be guaranteed to be secure or error free as information could be intercepted, corrupted, lost, destroyed, arrive late or incomplete, or contain viruses. Unicorn does not accept liability for any errors or omissions in the contents of this publication, which may arise as a result of electronic transmission. This advertisement has not been reviewed by the Monetary Authority of Singapore.
Unicorn Financial Solutions Pte. Limited Reg. No.: 200501540R